Sunday 31 January 2021

85% Dogecoin rally shows Wall Street Bets aren’t done with DOGE yet

85% Dogecoin rally shows Wall Street Bets aren’t done with DOGE yet

After gaining the spotlight due to a 980% pump on Jan. 28, Dogecoin (DOGE) briefly entered the top 10 ranking by market capitalization for the first time since 2015. Once the massive pump lost momentum and traders quickly took profits, it seemed that investors would move on past the meme-based cryptocurrency and find something else to invest in. 

The pump initially started when exchanges prevented retail traders from buying more GameStop and AMC stock on Jan. 28. Fueled by the Reddit discussion group r/Wallstreetbets, the army of investors turned their attention to silver and a selection of ‘cheap’ cryptocurrenceis.

On Jan.28, Twitter user “WSB Chairman” asked, “Has Doge ever been to a dollar?” to his 750,000 followers. That was enough to trigger the monster rally, despite Dogecoin having no protocol upgrades or developments since 2015.


DOGE/USDT 1-hour chart. Source: TradingView

The 68% retracement that followed the peak at $0.087 resembled Bitcoin’s (BTC) sharp drop after the December 2017 crash, except this time around, instead of 50 days, it took only 24 hours.

Multiple social media influencers and streamers expressed their discontent at buying the top, an indication that the momentary speculative frenzy had passed. After spending most of Jan. 30 and Jan. 31 hovering around $0.03, DOGE managed to produce another 80% pump in less than three hours.

It’s almost impossible to find the exact trigger for those events, as there are multiple social networks, including private Telegram groups and trading signal apps.

Reddit’s r/SatoshiStreetBets currently has 213,000 active users and following DOGE’s breakout a meme-post by user Woke_AF_Populist quickly climbed to its most upvoted list.


Wall Street Bets’ crypto sub-Reddit. Source: Reddit

There seems to be endless support from the Dogecoin fanbase, including Tesla’s CEO and founder Elon Musk. The lack of a concrete use case for the meme-coin certainly raises the question of whether members of r/WallStreetBets will jump ship from traditional markets and embrace the generally unregulated ethos of the cryptocurrency sector.


Dogecoin price vs 30 day average Tweet volume. Source: TheTie

Regardless of the outcome, from now on, measuring social activity will become a norm instead of an alternative indicator.

author and do not necessarily reflect the views of Cointelegraph. Every investment and trading move involves risk. You should conduct your own research when making a decision.

2021's Most Anticipated Growth & Wealth-Building Opportunity

Join Thousands of Early Adopters Just Like You Who Want to Grow Capital and Truly Understand Cryptocurrency Together


This article originally syndicated from 85% Dogecoin rally shows Wall Street Bets aren’t done with DOGE yet
85% Dogecoin rally shows Wall Street Bets aren’t done with DOGE yet was originally published here https://magnewspress.blogspot.com/2021/01/85-dogecoin-rally-shows-wall-street.html

Top 5 cryptocurrencies to watch this week: BTC, ETH, UNI, ATOM, COMP

Top 5 cryptocurrencies to watch this week: BTC, ETH, UNI, ATOM, COMP

Over the past seven days, the crypto market saw an uptick in volatility as Bitcoin (BTC) and Dogecoin (DOGE) price rallied higher simply because of social media activity. In situations like these, traders who make their investment decisions based on emotions tend to incur heavy losses and this is exactly what happened last week.

Dogecoin’s (DOGE) recent pump and dump caused several new traders who bought due to FOMO to lose money within a short time and this scenario is likely to play out again as social media groups have decided that collective pumps of altcoins is a new method of investing.

A similar trend currently seems to be developing in Bitcoin (BTC), which has retraced a large portion of the up-move that was caused due to the “Elon pump” on Jan. 29. This shows that barring a few emotional buyers, most professional traders may have used the rally to lighten their long positions.


Crypto market data daily view. Source:Coin360

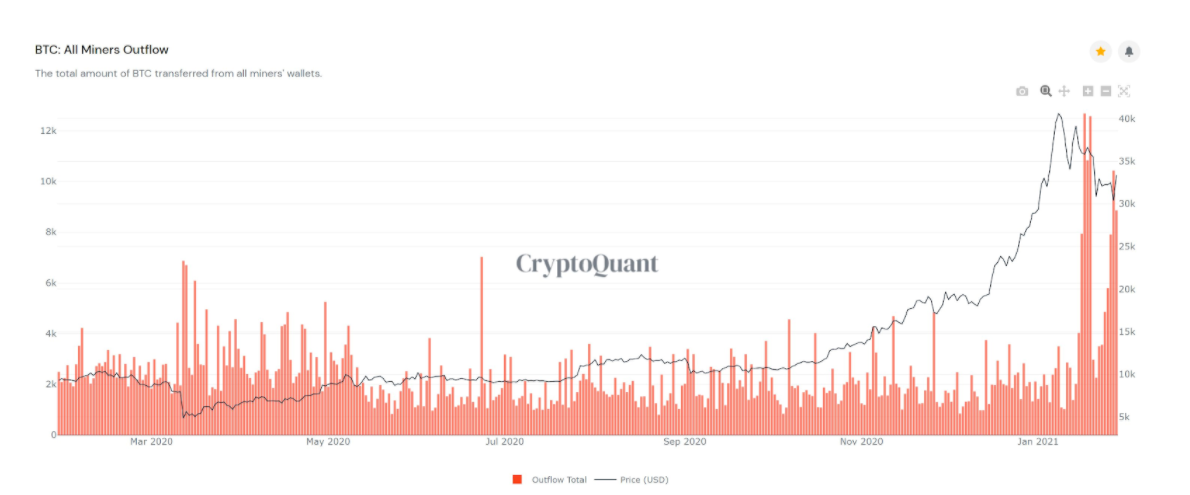
Stack Funds head of research Lennard Neo believes the Bitcoin miners are selling on rallies and that trend may continue as the Chinese New Year holiday approaches. Neo expects Bitcoin’s price to remain volatile in the near term.

Even as Bitcoin’s price consolidates, the decentralized finance tokens continue to surge, which suggests traders’ focus has shifted to the DeFi space. Let’s analyze the charts of the top-5 cryptocurrencies that could trend in the next few days.

BTC/USD

Bitcoin’s long wick on Jan. 29 shows the bears aggressively sold the rally above the downtrend line of the descending triangle. That was followed by a Doji candlestick pattern on Jan. 30, indicating indecision among the bulls and the bears.


BTC/USDT daily chart. Source: TradingView

The failure of the bulls to push the price above the downtrend line today has attracted further selling. The bears are currently trying to sustain the price below the 20-day exponential moving average ($33,395).

If they succeed, the BTC/USD pair may drop to the 50-day simple moving average ($30,631) and then to $28,850.

A breakdown and close below $28,850 will complete the bearish descending triangle pattern that has a target objective at $15,741. However, it is unlikely to be a straight fall because the bulls will try to arrest the decline at the 50% Fibonacci retracement level at $25,897.42 and again at the 61.8% retracement at $22,106.73.

This negative view will invalidate if the price turns up from the current level or rebounds off the $28,850 support and sustains above the downtrend line. Such a move will suggest strong accumulation at lower levels, which could result in a rise to $40,000.


BTC/USDT 4-hour chart. Source: TradingView

The 4-hour chart shows the breakout above the downtrend line met with strong selling pressure and the price quickly retracted back into the triangle.

The failure of the bulls to push the price back above the downtrend line has attracted selling and the bears have pulled the price below the 20-EMA. The bulls are currently attempting to defend the 50-SMA but if this support also cracks, the pair may start its journey towards $28,850.

This negative view will invalidate if the price rebounds off the current level and rises above the downtrend line. Such a move could push the price to $38,519.63.

ETH/USD

Ether (ETH) broke above the $1,400 resistance on three previous occasions but the bulls could not sustain the breakout, which shows profit-booking at higher levels. However, the positive thing is that the bulls have not given up much ground in the past few days. This shows the bulls are accumulating on dips.


ETH/USDT daily chart. Source: TradingView

The ETH/USD pair had formed a Doji candlestick pattern on Jan. 30, indicating uncertainty. That indecision has resolved to the downside today and the pair may now drop to the 20-day EMA ($1,253), which is likely to act as strong support.

A bounce off the support will suggest the sentiment remains bullish and traders are buying on dips. The bulls will then try to resume the uptrend. If the bulls can drive the price above the $1,400 to $1,473.096 resistance zone, the pair could rally to $1,675 and then to $2,000.

This bullish view will invalidate if the bears sink the price below the 20-day EMA and the uptrend line. In such a case, the pair may drop to the 50-day SMA ($990).


ETH/USDT 4-hour chart. Source: TradingView

The 4-hour chart shows the formation of an ascending triangle pattern, which will complete on a breakout and close above $1,440. This bullish setup has a target objective of $1,768.

However, the moving averages have flattened out and the relative strength index (RSI) is just below the midpoint, which suggests a balance between supply and demand.

If the bears sink the price below the support line of the triangle, it will invalidate the pattern. The next support on the downside is the uptrend line and then $1,050.

UNI/USD

Uniswap (UNI) is in a strong uptrend that has pushed the RSI deep into the overbought territory. While the RSI can remain overbought for an extended period, traders should be cautious as corrections from overbought levels can be swift and sharp.


UNI/USDT daily chart. Source: TradingView

The first support on the downside is the 38.2% Fibonacci retracement level at $15.3963. If the price rebounds off this level, it will suggest the bulls are aggressively buying the dips and are not waiting for a deeper correction to enter.

If the bulls can push the price above $20.5612, the UNI/USD pair could rally to $28 and then to $32. Both moving averages are rising and the RSI is above 79, indicating the bulls are in control.

However, if the correction deepens below $15.3963, the next support is at the 20-day EMA ($11.85), which is near the 61.8% Fibonacci retracement level at $12.2054. A deeper fall usually delays the start of the next leg of the uptrend.


UNI/USDT 4-hour chart. Source: TradingView

The 4-hour chart shows the pair has made a flag pattern. If the bulls can push the price above the flag, the uptrend could resume and the pair may rally to $22 and then to $25.

Another possibility is that the pair continues to correct and drop to the 20-EMA. If the price rebounds off this support, it will suggest the sentiment remains positive and the bulls are buying on minor dips.

During the current leg of the uptrend, the price has repeatedly taken support at the 20-EMA. Therefore, a break below the 20-EMA will suggest the bullish sentiment may be waning and could result in a drop to $15.3963 and then to the 50-SMA.

TOM/USD

Cosmos (ATOM) has formed a cup and handle pattern that will complete on a breakout and close above $8.877. If the bulls can propel the price above the $10.20 resistance, the uptrend could begin.


ATOM/USDT daily chart. Source: TradingView

The first target on the upside is $11.151 and the next level to watch out for is $13.554. The rising moving averages and the RSI’s bounce from the midpoint suggest the bulls have the upper hand.

If the bears sink the price below the 20-day EMA ($7.65), the ATOM/USD pair may remain range-bound between $6.603 and $8.877 for a few more days.

The bullish assumption will be negated if the bears sink and sustain the price below the 50-day SMA ($6.4). Such a move may pull the price down to $5.50 and then to $4.50.


ATOM/USDT 4-hour chart. Source: TradingView

The 4-hour chart shows the bulls have pushed the price above the downtrend line of the descending triangle. This has invalidated the bearish setup but the bulls are struggling to thrust the price above the $8.877 resistance.

The flat moving averages and the RSI near the midpoint suggest the pair may remain range-bound between $8.877 and $6.726 for some more time. If the bulls can propel the price above $8.877, the pair could rise to $10.20, while a break below $6.726 will suggest the bears are trying to make a comeback.

COMP/USD

Compound (COMP) completed a rounding bottom pattern on Jan. 29 when it broke and closed above the $272.61 resistance. This reversal setup has a target objective of $464.60.


COMP/USDT daily chart. Source: TradingView

The upsloping moving averages and the RSI near the overbought territory suggest bulls are in command. After the breakout from a pattern, the price usually retraces and retests the breakout level, but if the trend is very strong, it only consolidates or enters a minor correction before resuming the up-move.

If the COMP/USD pair rebounds off $272.61, it will suggest the bulls have flipped the previous resistance into support. That could then act as a launchpad for the next leg of the uptrend.

This positive view will invalidate if the bears sink and sustain the price below $272.61. Such a move will indicate profit-booking at higher levels and a lack of buying on dips.


COMP/USDT 4-hour chart. Source: TradingView

The 4-hour chart shows traders booked profits near $340 but the correction was short-lived as the price turned up from $304.84. If the bulls can now drive the price above $340, the pair may rally to $405.

On the other hand, if the price again turns down from $340, the pair may drop to the 20-EMA. If the price rebounds off this support, the bulls will again try to resume the up-move, but if the bears sink the pair below the 20-day EMA, a drop to $272.61 will be on the cards.

2021's Most Anticipated Growth & Wealth-Building Opportunity

Join Thousands of Early Adopters Just Like You Who Want to Grow Capital and Truly Understand Cryptocurrency Together


This article originally syndicated from Top 5 cryptocurrencies to watch this week: BTC, ETH, UNI, ATOM, COMP
Top 5 cryptocurrencies to watch this week: BTC, ETH, UNI, ATOM, COMP was originally published here https://magnewspress.blogspot.com/2021/01/top-5-cryptocurrencies-to-watch-this.html

Thanks Bitcoin, MicroStrategy stock is up 113% since being downgraded by Citigroup

Thanks Bitcoin, MicroStrategy stock is up 113% since being downgraded by Citigroup

On Dec. 8, 2020, Citigroup, one of the largest banks in the world, downgraded MicroStrategy’ss stock (MSTR). Since then, MSTR stock is up 113.27% from $289.45 to $617.31, as the price of Bitcoin (BTC) rallied.

In the same period, the Citigroup stock has declined slightly by 0.63%, from $58.36 to $57.99.


MicroStrategy stock vs. BTC and Nasdaq. Source: ecoinmetrics

Why has MicroStrategy stock performed so strongly despite the downgrade?

MicroStrategy has been investing its treasury holdings in Bitcoin, making BTC is treasury reserve asset. Currently, it is the biggest public company holder with over 70K BTC worth roughly $2.4 billion at today’s prices. 

Moreover, on Dec. 9, 2020, MicroStrategy announced raising $550 million in capital from convertible bonds.

In an official statement, MicroStrategy explicitly said that it intends to invest in Bitcoin with the proceeds of the bond. This is also the statement that is said to have triggered Citi to downgrade MicroStrategy. The statement read:

“MicroStrategy intends to invest the net proceeds from the sale of the notes in bitcoin in accordance with its Treasury Reserve Policy pending the identification of working capital needs and other general corporate purposes.”

At the time, Citigroup analyst Tyler Radke issued a sell rating. He acknowledged that the return on MicroStrategy’s Bitcoin investment has been “impressive,” but said the market is overpricing the core business of the firm. He wrote:

“MSTR’s bitcoin investment has returned $250M (or worth $26/share or +20% towards stock) since August ’20. While impressive, it pales in comparison to the 172% return in the stock. At the current stock price, our analysis suggests that the market is pricing in much more optimistic valuation scenarios for the core business and Bitcoin.”

Since December 2020, however, the price of Bitcoin saw an explosive rally. While the skepticism toward the core business of MicroStrategy could have some merit, BTC saw a rally of over 100% in the last month of the year.

In just December, Bitcoin rallied from $18,319 to over $42,000 on Binance, outperforming most assets in both the stock market and the crypto market.

What’s next?

MicroStrategy remains an important multi-billion dollar business intelligence firm with strong core business.

But as long as the price of Bitcoin continues to increase in the near term, it will likely have a positive impact on the stock price of MSTR.

Michael Saylor, the CEO of MicroStrategy, remains fully confident in the company’s position on Bitcoin, and often buying the price dips. In the fourth quarter financial results for 2020, Saylor wrote:

“Going forward, we continue to plan to hold our bitcoin and invest additional excess cash flows in bitcoin. Additionally, we will explore various approaches to acquire additional bitcoin as part of our overall corporate strategy.”

2021's Most Anticipated Growth & Wealth-Building Opportunity

Join Thousands of Early Adopters Just Like You Who Want to Grow Capital and Truly Understand Cryptocurrency Together


This article originally syndicated from Thanks Bitcoin, MicroStrategy stock is up 113% since being downgraded by Citigroup
Thanks Bitcoin, MicroStrategy stock is up 113% since being downgraded by Citigroup was originally published here https://magnewspress.blogspot.com/2021/01/thanks-bitcoin-microstrategy-stock-is.html

Is the weakness of Bitcoin after the ‘Elon Musk pump’ hinting at a bull trap?

Is the weakness of Bitcoin after the ‘Elon Musk pump’ hinting at a bull trap?

The price of Bitcoin (BTC) is showing overall weakness as it struggles to establish $34,000 as a support level. Overall, BTC appears to be stagnating without signs of a short-term relief rally, leading traders to be cautious.

One concerning trend is that the volume of Bitcoin has been stagnating along with its price, apart from the “Elon pump” on Jan. 29. This trend indicates that there is an overall drop in buyer demand since the $42,000 top despite BTC hovering in the low $30,000 region.


BTC/USDT 4-hour price chart (Binance). Source: TradingView.com

Bitcoin gets choppy after revisiting $38,000

On Jan. 29, the price of Bitcoin rose to as high as $38,461 on Binance after Tesla CEO and the world’s richest man, Elon Musk, ostensibly showed support for Bitcoin.

However, before this rally, on-chain analysts were already warning that the momentum of Bitcoin was slowing.

Ki Young Ju, the CEO of CryptoQuant, for example, pinpointed the high selling pressure from Bitcoin miners as a sign of a short-term bearish scenario.

Although the price of Bitcoin briefly surged 14%, it snapped back down to sub-$34,000 within 24 hours. Hence, weakening on-chain indicators were likely a warning that BTC would retrace most of its “Elon pump” gains. 

Ki wrote before the rally:

“Exchange Whale Ratio hit the eight-month high, meaning $BTC might have a large red candle if the price drops. It’s supposed to be below 85% if this bull-run is legit. Otherwise, it’s likely to be a bull trap.”

Whales likely sold as the price of Bitcoin abruptly surged to the $38,000 resistance level, causing a sharp correction.

With shaky on-chain indicators and some selling pressure coming from miners, traders are also showing caution about longing BTC/USD in the near term. 

A pseudonymous trader known as “Salsa Tekila” said that he is not using leverage until Bitcoin breaks out or drops back to $30,000. He said:

“We’re at that point where $BTC is far enough from the 30k for me not to be comfortable longing with any form of leverage but at the same time I wouldn’t short. Therefore being spot long until a big down / legacy open / probably Monday morning is best. NO LEVERAGE”

Meanwhile, another popular pseudonymous trader known as “Byzantine General” argues that the rally is broken. Hence, even if Bitcoin is bullish in the macro picture, more downside is possible until it sees a convincing breakout on lower time frames. He noted:

“The bull run is still on IMO, but the rally is broken. If we re-claim the yearly TWAP we can continue ze pump, but until then it looks kinda meh.”

Bitcoin price chart with TWAP level. Source: TradingView.com, Byzantine General

What to watch out for

Traders and technical analysts are closely observing Bitcoin’s reaction to the $34,500 to $35,000 range.

If Bitcoin breaks out of it with strength, momentum, and high volume, then the probability of a short-term trend reversal rises.

However, if Bitcoin struggles to retest the $34,500 resistance level and continues to stagnate in the $33,000 region, the risk of a further breakdown to the $33,000 support remains.


Crypto Fear and Green Index (78 or “extreme greed”). Source: Digital Assets Data 

Additional signs that BTC price could see another pullback include the Crypto Fear and Greed index remaining at “extreme greed” levels and Google searches for “Bitcoin” dropping by 50% since multi-year highs seen earlier this month. 

2021's Most Anticipated Growth & Wealth-Building Opportunity

Join Thousands of Early Adopters Just Like You Who Want to Grow Capital and Truly Understand Cryptocurrency Together


This article originally syndicated from Is the weakness of Bitcoin after the ‘Elon Musk pump’ hinting at a bull trap?
Is the weakness of Bitcoin after the ‘Elon Musk pump’ hinting at a bull trap? was originally published here https://magnewspress.blogspot.com/2021/01/is-weakness-of-bitcoin-after-elon-musk.html

Saturday 30 January 2021

FTX Token (FTT) rallies 105% as interest in derivatives trading grows

FTX Token (FTT) rallies 105% as interest in derivatives trading grows

FTX is a cryptocurrency derivatives exchange backed by Alameda Research, a quantitative trading firm and crypto liquidity provider. 

The exchange launched in April 2019 and offered the usual spot trading, inverse swaps and futures contracts that can be found at other major platforms. By early 2020, the exchange launched its daily and weekly binary BTC options markets.


FTT/USDT daily chart. Source: TradingView

FTT is the exchange’s native token and it’s issued on the Ethereum blockchain. FTT stakers are granted a trading fee discount based on a tiered system and other benefits include bonus votes in their polls and increased airdrop rewards.

The first airdrop took place in August 2020 when 500 million Serum (SRM) tokens were distributed to FTT holders. To differentiate itself from competitors, the users’ collateral is shared in one universal stablecoin wallet.

This means traders can reduce their margin requirements drastically. Numerous leveraged tokens mimicking leveraged ETF stocks have also been listed, including 3x Long Bitcoin and 3x Short Litecoin.

Leveraged tokens are derived from the exchange’s perpetual swap contracts and operate as tradeable ERC-20 tokens that can be withdrawn and traded. These innovative products have made the FTX a popular exchange among investors, as reflected by its rising futures contracts open interest.


Global markets aggregate open interest. Source: coinalyze.net

As shown above, the figure grew by 340% over the past six months, surpassing the $2 billion mark to vastly outperform more established exchanges.

In November 2020, the exchange ventured into tokenized equity trading, albeit not available for its U.S. citizens. Its partner CM-Equity custody the tokens redeemable for the underlying stocks. Interestingly, it’s allowed its users to buy less than one share, which is particularly useful for high-priced stocks like Amazon ($AMZN) and Google ($GOOG).

In December, FTX continued to innovate by launching pre-IPO futures contracts for AirBNB and Coinbase. These contracts allow traders to speculate on what price those companies will list on a stock exchange. The exchange also offers trading for thematic products, including a basket of cannabis-related listed stocks.

By creating multiple markets with enough liquidity provided by its market-making structure, the exchange was able to gather attention from a new client base. More recently, a Wall Street Bets index was launched, including GameStop ($GME), Dogecoin (DOGE), and iShares Silver Trust ($SLV).

Backed by these popular offerings, FTX Token (FTT) price has doubled since the beginning of 2021.


FTX Token (FTT) token price at Binance. Source: TradingView

To further incentivize holding the token, FTX repurchases and burns 33% of all fees generated from the exchange and 10% of its insurance fund net additions. This process will continue until half of the initial 350 million supply are destroyed.

While this may appear like a deflationary schedule, there are 31.25 million tokens allocated to the team, representing at least 17.8% of the targeted 175 million circulating supply. Regardless, considering the current $11.70 token price, its market capitalization after the burn process is completed surpasses $2 billion.

This number represents a 45% discount to Binance Coin’s (BNB) projected 2031 market capitalization, according to data from Messari. This is also roughly in line with the exchanges’ aggregate open interest $4.26 billion to $2.0 billion difference .

Interestingly, Binance has an undisclosed investment in FTX, and this may be creating fewer incentives for direct competition.

Currently, it seems that the market is pricing both tokens at the same valuation. Binance appears to be expanding its ecosystem via its Binance Smart Chain decentralized exchange, their blockchain projects incubator and a successful token launchpad platform.

FTX, on the other hand, is focused on being the market-leader of derivatives products innovation.

Currently all of these projects are producing value for token holders and with the burn schedule and rising popularity among derivatives exchanges it’s possible that FTT will continue to see further price appreciation.

author and do not necessarily reflect the views of Cointelegraph. Every investment and trading move involves risk. You should conduct your own research when making a decision.

2021's Most Anticipated Growth & Wealth-Building Opportunity

Join Thousands of Early Adopters Just Like You Who Want to Grow Capital and Truly Understand Cryptocurrency Together


This article originally syndicated from FTX Token (FTT) rallies 105% as interest in derivatives trading grows
FTX Token (FTT) rallies 105% as interest in derivatives trading grows was originally published here https://magnewspress.blogspot.com/2021/01/ftx-token-ftt-rallies-105-as-interest.html

XRP price gains 86% after Wall Street Bets’ crypto wing says ‘pump it’

XRP price gains 86% after Wall Street Bets’ crypto wing says ‘pump it’

XRP price underwent a strong 86% breakout in the early trading hours on Jan. 30 as the fourth-ranked cryptocurrency by market cap became the new coin of focus in the r/Wallstreetbets cryptocurrency-focused off-shoot r/Satoshistreetbets. 

Data from Cointelegraph Markets and TradingView shows that XRP rose from $0.28 to a peak at $0.51 before profit selling pulled the price back to $0.41.


XRP/USDT 15 minute chart. Source: TradingView

It appears that the antics of the past week which saw r/Wallstreetbets pump GameStop, AMC and Dogecoin (DOGE), have carried over into the weekend as Stellar (XLM) also saw its price pump in tandem with XRP.

After rallying more than 800%, DOGE price is now down 71% from its recent all-time high of $0.078 on Jan. 29. Data from TheTIE also shows that the rally in XRP price coincided with a drastic jump in tweet volume.


XRP price vs. Tweet volume. Source: TheTIE

Stellar (XLM) has also received some attention from r/Satoshistreetbets, resulting in a price spike of 64% on Jan. 27 which saw the price of XLM reach as high as $0.38 before correcting to its current value of $0.318.

XRP’s legal woes may place a damper on the rally

In the past few months, XRP price has been hard hit due to a lawsuit filed against Ripple by the U.S. Securities Exchange Commission (SEC). The SEC alleges that the company is conducting an ongoing illegal securities offering as Ripple still periodically sells XRP tokens out of the treasury.

Ripple recently filed a Freedom of Information Act request with the SEC seeking documents pertaining to Ethereum co-founders.

The company is demanding to know why Ether (ETH) isn’t considered a security and said that the government body “clearly picked two winners and ignored a growing and robust industry that is much larger than Bitcoin and Ether.”

2021's Most Anticipated Growth & Wealth-Building Opportunity

Join Thousands of Early Adopters Just Like You Who Want to Grow Capital and Truly Understand Cryptocurrency Together


This article originally syndicated from XRP price gains 86% after Wall Street Bets’ crypto wing says ‘pump it’
XRP price gains 86% after Wall Street Bets’ crypto wing says ‘pump it’ was originally published here https://magnewspress.blogspot.com/2021/01/xrp-price-gains-86-after-wall-street.html

GameStop mayhem, Robinhood scandal, Musk tweets, DOGE explodes: Hodler’s Digest, Jan. 24–30

GameStop mayhem, Robinhood scandal, Musk tweets, DOGE explodes: Hodler’s Digest, Jan. 24–30

2021's Most Anticipated Growth & Wealth-Building Opportunity

Join Thousands of Early Adopters Just Like You Who Want to Grow Capital and Truly Understand Cryptocurrency Together


This article originally syndicated from GameStop mayhem, Robinhood scandal, Musk tweets, DOGE explodes: Hodler’s Digest, Jan. 24–30
GameStop mayhem, Robinhood scandal, Musk tweets, DOGE explodes: Hodler’s Digest, Jan. 24–30 was originally published here https://magnewspress.blogspot.com/2021/01/gamestop-mayhem-robinhood-scandal-musk.html

BTC billionaire Tim Draper to Elon Musk: I’d buy the Tesla Cybertruck with Bitcoin

BTC billionaire Tim Draper to Elon Musk: I’d buy the Tesla Cybertruck with Bitcoin

Tim Draper, the billionaire Bitcoin (BTC) investor who also invested early in Tesla, reacted to the company’s CEO and world’s richest man, Elon Musk, adding #Bitcoin to his Twitter bio to join the likes of Twitter CEO Jack Dorsey and Reddit co-founder Alexis Ohanian.

Draper, who holds around 30,000 BTC according to reports, told Musk that he would like to pay for the Tesla cybertruck with BTC while promoting his Bitcoin payment processor portfolio company OpenNode. He said:

“Hi Elon Musk, I would like to buy a Tesla cybertruck. Although I personally would rather keep my own #bitcoin, you can accept #bitcoin through our Draper VC company OpenNode.”

Why now?

On Jan. 29, Bitcoin proceeded to rally by 14% in merely 30 minutes shortly after Elon Musk’s Bitcoin support began circulating on social media. 

Many speculated that Musk could have been the high-net-worth investor behind the massive Bitcoin accumulation on Coinbase in the past week.

In the past several days, the premium on Coinbase skyrocketed to around $200, compared to Binance. This usually indicates significant buying activity from U.S. investors.

However, Musk did not follow up on the bio change, and overnight, the rally reversed. Bitcoin rose from $33,000 to over $38,000, and dropped back down to $33,000.

Draper likely tweeted at Musk due the interest in Bitcoin from Musk and the positive market sentiment around BTC.

In a recent interview with CNBC, Draper said that he is actually buying more Bitcoin. Draper also said that he does not intend to sell BTC in the future, expressing his strong belief in Bitcoin as a “currency of the future.” He said:

“I’m actually just buying more [Bitcoin]… I have no interest in ever selling my #Bitcoin for dollars. Why would I take the currency of the future and sell it for the currency of the past?”

On-chain data shows that Draper isn’t the only one focused on long term gains.  In fact, “HODLing” activity, which indicates the intent of Bitcoin investors to hold BTC for a long time, is at record highs.


Bitcoin 1-year HODL wave. Source: Lookintobitcoin

Will Bitcoin ever be used as a currency?

Bitcoin is increasingly becoming considered as a store of value and an alternative to gold as a safe-haven asset. In recent months, though, the correlation and inverse correlation between Bitcoin, gold and stocks have been decreasing. 


Bitcoin correlation vs. S&P500,VIX, DXY, Gold. Source: Digital Assets Data

In addition to the massive price gains, the fear of inflation and the large injection of liquidity by central banks have stirred massive interest among institutional and high-net-worth investors.

But while accepting BTC is becoming increasingly common, the question remains whether Bitcoin would ever be used as a currency and a medium of exchange like the dollar today.

Ironically, when the price of Bitcoin is in a clear uptrend, investors are less likely to sell or spend their BTC. Draper himself is suggesting that he will probably pay the $40,000 for the Cybertruck with dollars rather than the “currency of the future.”

However, if Bitcoin price stabilizes in the future at a high enough price level and sees lower volatility, then BTC could become more compelling for everyday payments.

Meanwhile, as the network gains more users and must scale, the Bitcoin blockchain network may ultimately become inefficient to use for everyday payments on the first layer. 

At that point, second-layer scaling solutions, like Lightning Network and sidechains like Liquid, for example, may become the blockchain “apps” for processing small payments instantly. Such interoperable platforms will likely have their own tradeoffs with varying degrees of trustlessness, privacy and decentralization.

2021's Most Anticipated Growth & Wealth-Building Opportunity

Join Thousands of Early Adopters Just Like You Who Want to Grow Capital and Truly Understand Cryptocurrency Together


This article originally syndicated from BTC billionaire Tim Draper to Elon Musk: I’d buy the Tesla Cybertruck with Bitcoin
BTC billionaire Tim Draper to Elon Musk: I’d buy the Tesla Cybertruck with Bitcoin was originally published here https://magnewspress.blogspot.com/2021/01/btc-billionaire-tim-draper-to-elon-musk.html

Bitcoin price chart shows ‘Elon Musk’ pump was an outlier — So what happens now?

Bitcoin price chart shows ‘Elon Musk’ pump was an outlier — So what happens now?

Bitcoin (BTC) has seen a very volatile week, as the price of Bitcoin jumped around from $32,000 to $38,500 and back toward $33,000 in a matter of 24 hours. 

The initial spike to $38,500 happened in minutes after Elon Musk added #Bitcoin to his Twitter profile.

However, no follow-up of that price movement was seen on the charts as Bitcoin dropped substantially in the following hours. Currently, the $34,500 area is a significant resistance zone to break through if the market wants to sustain the bullish momentum.

Failure to break $38,000 causing dropdown


XBT/USD 4-hour chart. Source: TradingView

The levels that are critical to watch are highlighted in the chart above. Simply put, $38,000 must break for the rally to continue. Flipping this level for support opens the door to new all-time highs.

However, the surge couldn’t be sustained yesterday. After the $38,000 level’s failure, the $34,000 level couldn’t provide the heavily needed support for further upward momentum.

Therefore, the “Elon Musk pump” can be considered an outlier, and the general trend continues. This is a downtrend since the peak high at $42,000 that most likely will continue unless Bitcoin’s price can break through $34,500 and flip it into support.

Dollar showing strength is bad news for Bitcoin


U.S. Dollar Currency Index 1-day chart. Source: TradingView

One of the primary arguments for more Bitcoin downside would be the recovering U.S. Dollar Currency Index (DXY). This index shows a potential bottoming formation as a bullish divergence is seen at the significant 90-point level.

After this, the bullish divergence will be confirmed through a higher low, indicating that more upside is likely. 

Remarkably, the previous relief rally on the DXY Index in September caused a 20% correction for Bitcoin. However, since that relief rally, the DXY Index has shown massive weakness, one of the significant variables for the enormous increase of Bitcoin’s price to $42,000.

However, February isn’t the best month for equities. The same can be concluded about Bitcoin, as February 2018 was when Bitcoin crashed to $6,000 after hitting its previous all-time high.

Therefore, a rebounding DXY could add to the bearish sentiment for Bitcoin in February as well.

Bitcoin Dominance Index eyes relief rally


BTC Dominance 1-week chart. Source: TradingView

Historical charts show previous market behavior with many patterns being cyclical. 

When Bitcoin’s dominance topped out in December, massive surges were seen across the altcoin market. However, after such an enormous rally, a healthy correction would not come as a surprise to test previous resistance levels.

Those tests would mean a bounce for Bitcoin dominance in February, which may open the door for a huge run for the entire crypto market from March onwards.

Critical levels to watch for Bitcoin


XBT/USD 3-hour chart. Source: TradingView

The critical levels to watch are easy to see in the chart above. First, Bitcoin’s price has to reclaim the $34,500 level as support to sustain bullish momentum. If that happens, the level at $38,000 will be retested. Most likely, that test will result in a breakout above $38,000 toward the all-time high. 

However, if Bitcoin’s price can’t break through $34,500, further downward momentum is likely, as the chart shows. In that perspective, the critical level to watch is the $30,000 region. If that fails to sustain support (after numerous tests already), I expect a drop toward $25,000 and the 21-Week MA.

author and do not necessarily reflect the views of Cointelegraph. Every investment and trading move involves risk. You should conduct your own research when making a decision.

2021's Most Anticipated Growth & Wealth-Building Opportunity

Join Thousands of Early Adopters Just Like You Who Want to Grow Capital and Truly Understand Cryptocurrency Together


This article originally syndicated from Bitcoin price chart shows ‘Elon Musk’ pump was an outlier — So what happens now?
Bitcoin price chart shows ‘Elon Musk’ pump was an outlier — So what happens now? was originally published here https://magnewspress.blogspot.com/2021/01/bitcoin-price-chart-shows-elon-musk.html

Analyst says Bitcoin price sell-off may occur as Chinese New Year approaches

Analyst says Bitcoin price sell-off may occur as Chinese New Year approaches

On Jan. 29 Bitcoin (BTC) price briefly rallied to $38,500 before retracing the move and spending the majority of the day struggling to reclaim $35,000. 

The wild breakout in Bitcoin price has partially been attributed to Elon Musk changing his Twitter profile to simply “#Bitcoin,” which Musk subsequently followed up with a cryptic tweet saying “In retrospect, it was inevitable.”

Dogecoin (DOGE) also continued to make waves across Twitter and with crypto traders. After reaching a new all-time high at $0.078 on Jan. 28, DOGE price corrected by 41% before rebounding to trade at $0.045.


Daily cryptocurrency market performance. Source: Coin360

Developments related to DOGE and r/Wallstreetbets led FTX crypto exchange to create a Wall Street Bets (WSB) index which tracks the price of Nokia (NOK), BlackBerry (BB), AMC Theaters (AMC), GameStop (GME), Silver (SLV), DOGE, and the FTX Token (FTT) using a weighted average of their prices.

The exploits of the popular Reddit group have also not gone unnoticed by the United States Securities and Exchange Commission, which announced that it will be taking a closer look at how Robinhood handled the trading of GME stock on its platform.

Bitcoin price holds strong despite miners selling

Despite the recent volatility, institutional investors continue to show an increased interest in Bitcoin and are willing to pay a premium to get exposure to CME’s Bitcoin futures contracts.

Even selling pressure from Bitcoin miners, who have been selling at levels not seen since BTC price topped out at $14,000 in July 2019, has not been able to satisfy increasing demand. Unlike previous years, mass selling from miners is not negatively affecting the long-term price of BTC, as shown by data from CryptoQuant.


Bitcoin miner’s outflow. Source: CryptoQuant

According to Lennard Neo, the head of research at Stack Funds, the current miner sell-off is likely to continue in the near-term due to the upcoming Chinese New Year holiday.

Neo said:

“Miners are increasingly exiting their positions as the holiday approaches. This also suggests that the floor price for which miners are comfortable holding Bitcoins has yet to be found and we expect this volatility to persist in the coming weeks.”

Growing interest from institutions and the emergence of DeFi are big drivers of Bitcoin price growth. As the market heads into the Chinese New Year holiday, the key level of support to watch is now $34,000 while a move higher is likely to face resistance at $38,000.

The $4.9 billion worth of BTC futures that expired on Jan. 29 appears to have little effect on the market as this past week’s Robinhood ordeal is bringing more attention to the cryptocurrency industry.

The traditional markets faced a new wave of pressure which led to the worst weekly performance for the S&P 500. The Dow, NASDAQ and S&P 500 all finished the day negative, down 2.03%, 2.0% and 1.93% respectively.

ltcoins show signs of growth

While Bitcoin price struggled to hold the $34,000 level, DOGE made its way into the top-10 and a number of altcoins saw bullish breakouts.

XRP and Stellar (XLM) have both rose by roughly 9% in the past 24-hours, while Voyager Token (VGX) continued to climb higher, currently up 70% and trading at $1.77.


BTC/USD daily chart. Source: Coin360

The overall cryptocurrency market cap now stands at $1.01 trillion and Bitcoin’s dominance rate is 63.5%.

2021's Most Anticipated Growth & Wealth-Building Opportunity

Join Thousands of Early Adopters Just Like You Who Want to Grow Capital and Truly Understand Cryptocurrency Together


This article originally syndicated from Analyst says Bitcoin price sell-off may occur as Chinese New Year approaches
Analyst says Bitcoin price sell-off may occur as Chinese New Year approaches was originally published here https://magnewspress.blogspot.com/2021/01/analyst-says-bitcoin-price-sell-off-may.html

These are 5 common difficulties every business owner deals with-- right here's exactly how to plan for them

  To succeed as an entrepreneur, having a playbook for how to scale your service as well as process responses is crucial, according to Zuley...